
Comparative Analysis of InnoDB-Compatible Engines — Percona Lab Results
Interactive graphs available: Explore the full dataset dynamically — click any graph below to open the interactive version.
This report presents results from a comprehensive sysbench OLTP benchmark comparing 10 InnoDB-compatible database engine versions across three generations of MariaDB, MySQL, and Percona Server. Tests span three buffer pool tiers (2 GB, 12 GB, 32 GB), eight concurrency levels (1 to 512 threads), and three test scenarios — read-write local, read-only local, and read-write over a 10Gb/s network — yielding 700+ data points.
This benchmark was designed to provide vendor-neutral, reproducible performance data for MySQL-compatible open-source database engines. The goal is to quantify how each engine scales under OLTP read-write and read-only workloads at varying levels of concurrency and memory pressure — three dimensions that are critical for production capacity planning.
The study addresses the following primary questions:
Ten distinct engine versions were benchmarked, spanning three product families:
| Engine Family | Version | Branch / LTS Status |
|---|---|---|
| MariaDB | 10.11.16 | LTS |
| MariaDB | 11.4.10 | LTS |
| MariaDB | 12.1.2 | Development release |
| MySQL | 5.7.44 | EOL / legacy |
| MySQL | 8.0.45 | Active stable |
| MySQL | 8.4.8 | LTS |
| MySQL | 9.6.0 | Innovation Release |
| Percona Server | 5.7.44-48 | EOL / legacy |
| Percona Server | 8.0.45-36 | Active stable |
| Percona Server | 8.4.7-7 | LTS |
This summary is provided to give the reader an immediate overview of the most critical performance deltas and trends observed across all benchmark runs. It highlights which engine versions excel under specific conditions (high concurrency, read-only workload, I/O pressure) and quantifies the most significant generational improvements or regressions found in the data.
| Finding | Detail |
|---|---|
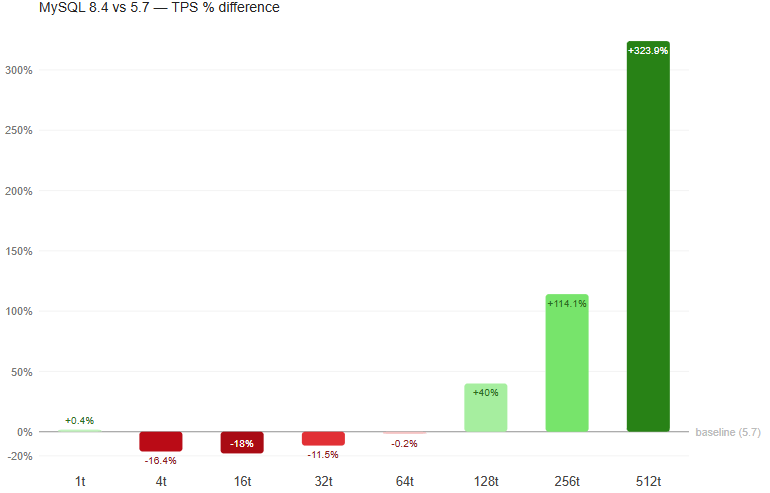
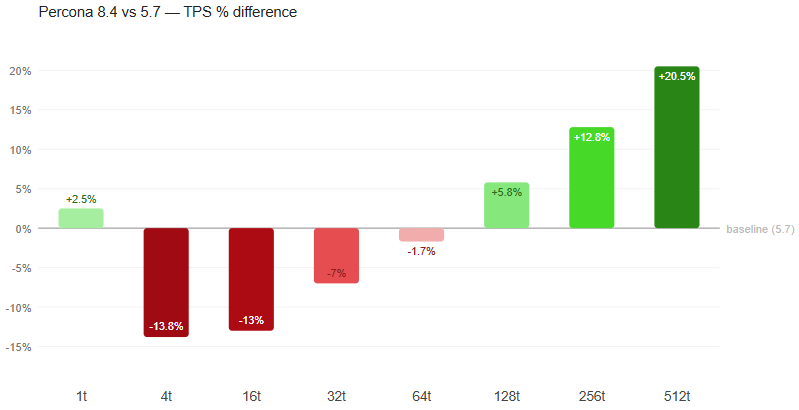
| Percona 8.4 / MySQL 8.4 lead RW at 32 GB | 13,385 / 13,325 TPS at 512 threads – best result at high concurrency. |
| MariaDB 10.11 dominates read-only | 32,392 TPS at 128 threads — 38% ahead of the next best engine |
| Percona 5.7 best under IO Bound Scenario with small cache size. | 813 TPS at 512 threads (2 GB tier) — continues scaling where modern engines collapse |
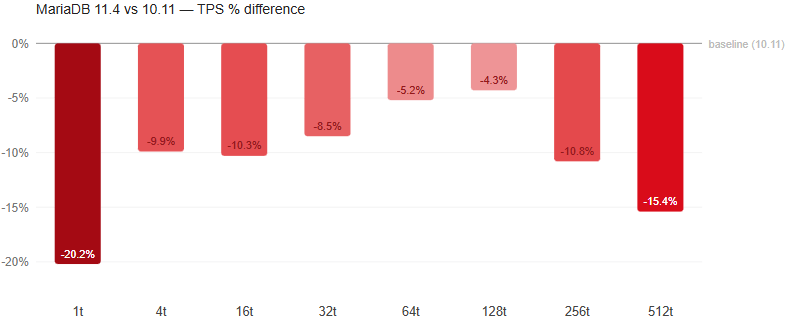
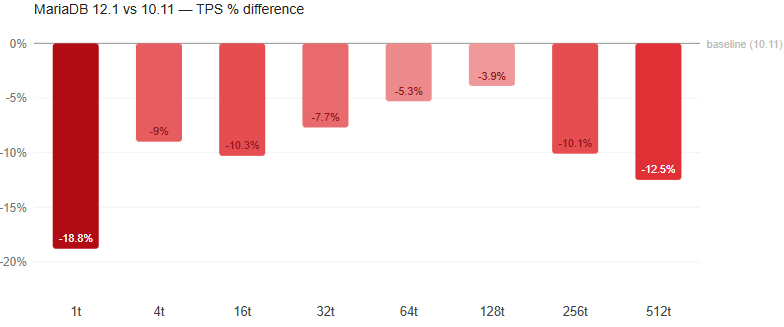
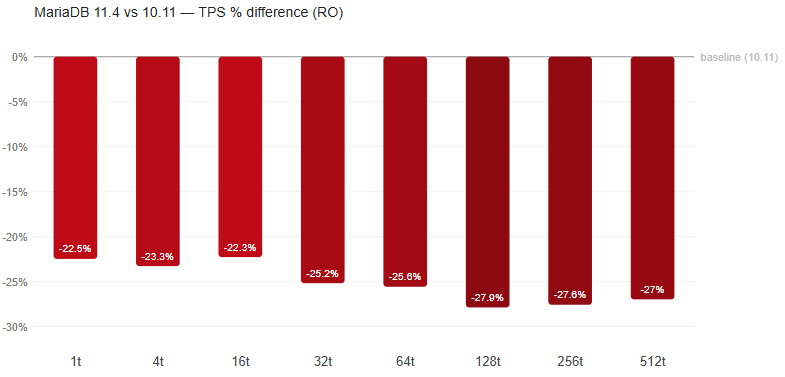
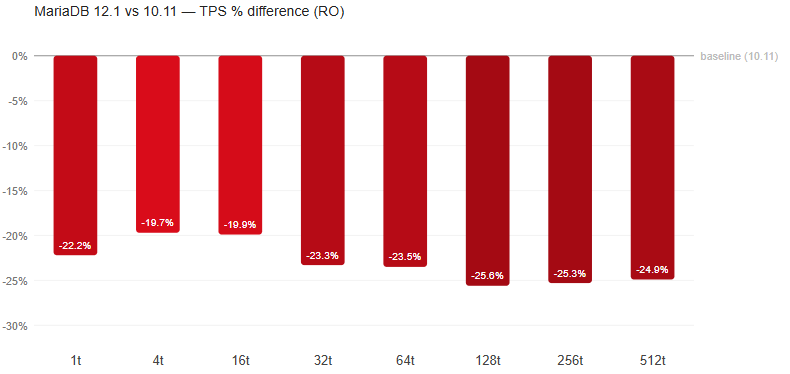
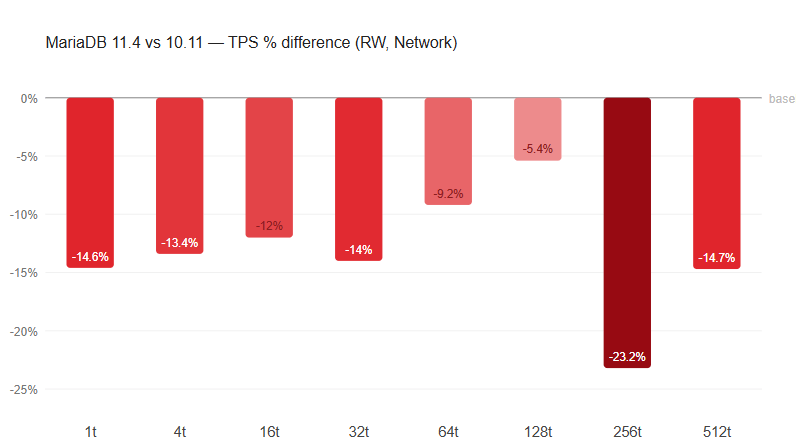
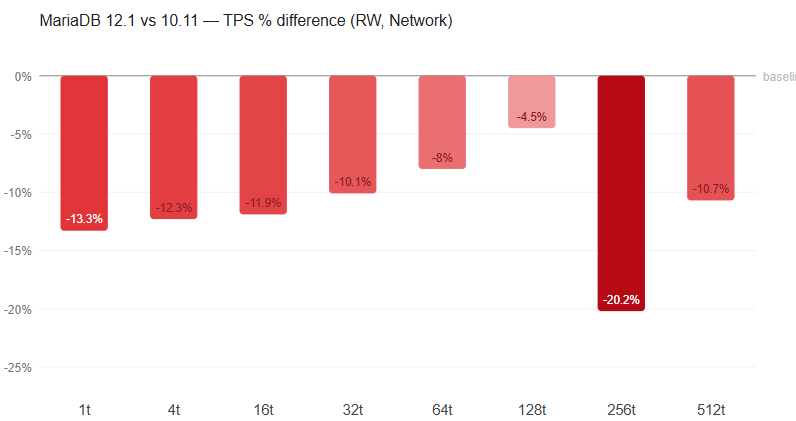
| MariaDB 12.1 regresses vs. 10.11 | 10.11 LTS retains substantial advantage, especially in read-only (~35% gap) |
| MySQL 5.7 collapses at high RO and RW concurrency | Peak at 32 threads with RO (13,684 TPS), 64 threads with RW (7,338 TPS), drops at 512 threads (RO: 3,889 TPS, RW: 3,144 TPS). |
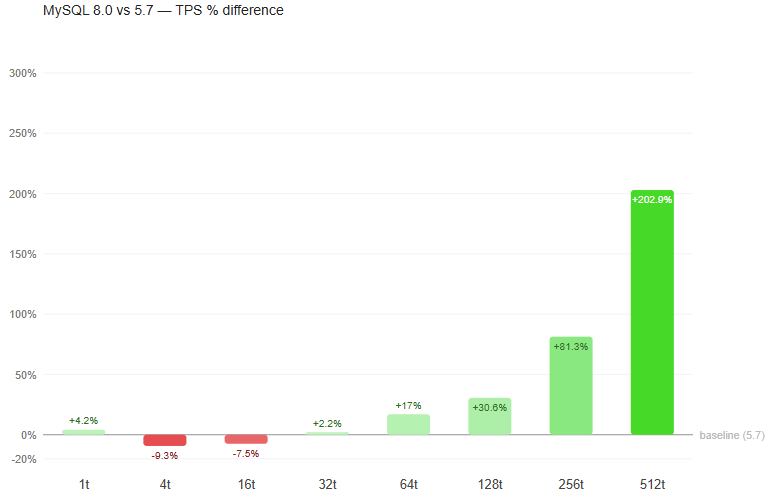
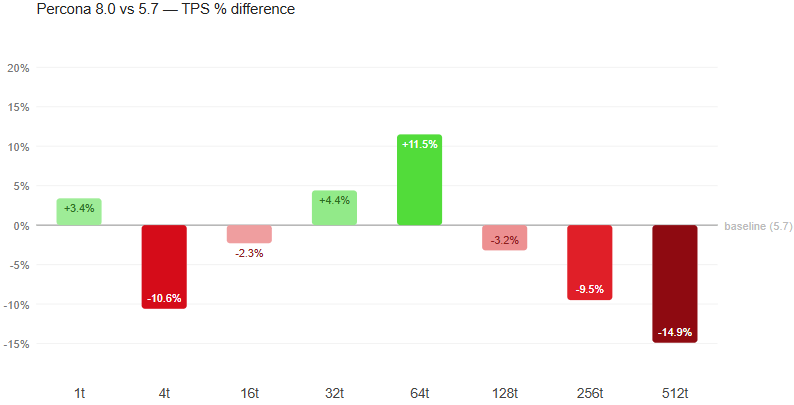
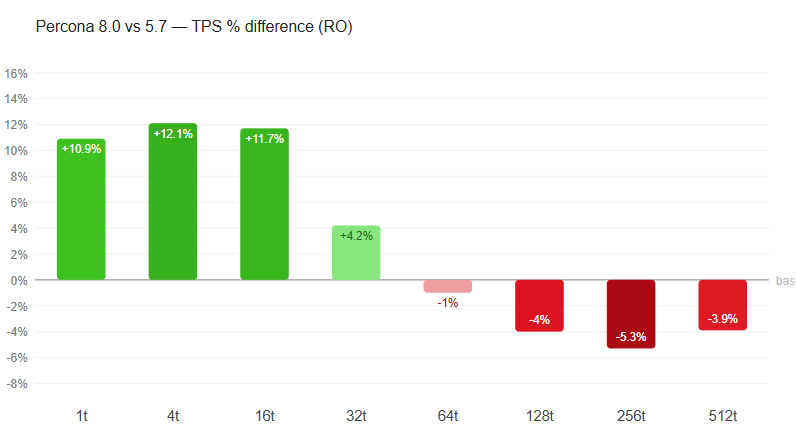
| MySQL 8.0 ≈ Percona 8.0 | Results differ by <3% across all conditions — Percona patches have negligible OLTP impact |
| Buffer Pool size adjustment causes a 12x to 25x throughput variation. | Percona 8.4 (Largest variation): 25.0×. MySQL 5.7 (Smallest variation): 12.8×. |
| Network adds 2–10% overhead | Local vs. network test runs show a throughput variation of 2–10%. |
| RO/RW ratio varies 1.7×–3.0× | MariaDB 10.11: 3.0×. MySQL 8.4 / Percona 8.4: 1.7–1.8× |
All benchmarks were executed on a single bare-metal host to eliminate network and virtualization overhead. The database server and benchmark client ran on the same machine (loopback connection) for local tests, and on separate machines connected via 10Gb/s Ethernet for network tests.
Hardware configuration of the host:
| Component | Specification |
|---|---|
| Architecture | x86-64 |
| Processors | physical = 2, cores = 40, virtual = 80, hyperthreading = yes |
| CPU Models | 80x Intel(R) Xeon(R) Gold 6230 CPU @ 2.10GHz |
| Memory Total | 187.5G |
| Storage | Device = /dev/sda, Model = INTEL SSDSC2KB96, Size = 894.3G, SATA |
Software Configuration:
| Component | Specification |
|---|---|
| OS | Ubuntu 22.04 LTS 64-bit |
| Release | 6.8.0-60-generic |
| Benchmark tool | sysbench 1.0.20 with LuaJIT 2.1.0-beta3 |
| Client connection | 127.0.0.1 loopback (local) / 10Gb/s Ethernet (network) |
| MySQL client | mysql-client (for version detection and config verification) |
| Telemetry | iostat, vmstat, mpstat, dstat (1-second interval during each run) |
| Container runtime | Docker (–network host, –user mysql) |
Each engine was run as a Docker container using official images (percona/percona-server, mariadb, mysql). The host network mode was used to avoid bridge networking overhead. A fresh container was started for each engine/tier combination using the following sequence:
SELECT VERSION()mysqladmin / mariadb-admin ping loop)
With the database size of 24G, three InnoDB buffer pool sizes were tested, each representing a distinct workload characteristic:
| Tier | innodb_buffer_pool_size | Workload Character |
|---|---|---|
| 2 GB | 2 GB | I/O bound — dataset substantially exceeds buffer pool (1:12); heavy read amplification |
| 12 GB | 12 GB | Mixed — partial dataset fits in memory (1:2); realistic production scenario |
| 32 GB | 32 GB | In-memory — full working set fits; CPU and locking are primary bottlenecks |
The schema contains 20 tables with 5M rows in each one adding up to 100M rows.
The size of the database files on the disk is 24G.
The schema dump can be downloaded from the interactive graphs page or directly at percona-lab-results.github.io/2026-interactive-metrics/schema_dump.sql.
A common configuration was applied to all engines to ensure fairness. Version-specific directives were layered on top (see 3.2).
| Parameter | Value | Rationale |
|---|---|---|
| innodb_buffer_pool_size | Tier-specific | Core variable — 2G / 12G / 32G per tier |
| innodb_buffer_pool_instances | 1 or 8 | 1 for <8 GB, 8 for ≥8 GB |
| max_connections | 4096 | Headroom above max 512 test threads |
| max_prepared_stmt_count | 1,000,000 | Prevents exhaustion under sysbench |
| innodb_io_capacity | 2500 | Typical NVMe baseline flush capacity |
| innodb_io_capacity_max | 5000 | Burst I/O ceiling |
| table_open_cache | 200,000 | Avoids cache thrash |
| table_open_cache_instances | 64 | Reduces mutex contention |
| character_set_server | utf8mb4 | Consistent charset across all versions |
| innodb_doublewrite | 1 | Data corruption prevention |
| innodb_flush_log_at_trx_commit | 1 | Full ACID compliance |
| innodb_flush_method | O_DIRECT | Bypass system cache |
| innodb_log_buffer_size | 64M | Staging area for redo log writes |
| sync_binlog | 1 | Flush binlog per transaction |
| binlog_format | ROW | Record row-level changes |
| binlog_row_image | MINIMAL | Only changed columns and PKs |
Configurations were branched based on detected major version:
MySQL / Percona 5.7 / 8.0: innodb_log_file_size=2G, innodb_log_files_in_group=2
MySQL 8.4 / 9.x: innodb_redo_log_capacity=4G, innodb_change_buffering=none (new redo log architecture)
MariaDB < 12.1: innodb_log_file_size=2G, innodb_log_files_in_group=2, query_cache_type=0, query_cache_size=0, thread_handling=one-thread-per-connection
MariaDB 12.1+: Same as above minus query_cache directives (removed in 12.1)
| Phase | Duration | Purpose |
|---|---|---|
| Warmup A — Read-Only | 180 s (3 min) | Populate buffer pool with hot pages |
| Warmup B — Read-Write | 600 s (10 min) | Steady-state redo log & dirty page ratio (skipped for RO) |
NOTE: The proposed warmup values are determined experimentally and are sufficient for the hardware configuration used for the benchmarking. However, in case of much slower hosts the user will need to adjust them by editing scripts.
Each measurement run lasted 900 seconds (15 minutes) with results reported at 1-second intervals. System telemetry (iostat, vmstat, mpstat, dstat) was collected concurrently.
The published data reflects a single run for each measurement. However, to check for the steady state, we performed selective 2nd and 3rd validation runs across various platforms and servers to confirm the consistency of the initial results.
We chose not to publish the validation runs to keep the results readable. With 980 base measurements generating 6 files each, adding the validation runs would have made the dataset difficult to navigate.
Reaching a steady state with reads was done by checking InnoDB and OS I/O read metrics to ensure they reach zero after a sufficient preheating stage.
The method with writes was to monitor the output metrics until they stabilized. However, a limitation must be acknowledged. A stable output over a shorter timeframe doesn’t entirely rule out delayed background jobs (like page flushing or insert buffer merges) that might surface if the database operated for days.
| Metric | Definition |
|---|---|
| TPS | Transactions per second (complete BEGIN/COMMIT cycles) |
| QPS | Queries per second (≈20× TPS for this workload) |
QPS/TPS gain relative to additional RAM; QPS/TPS gain relative to thread count increase.
Each run produced: .sysbench.txt, .iostat.txt, .vmstat.txt, .mpstat.txt, .dstat.txt. Each server config produced: .cnf.txt, .vars.txt, .status.txt, pt-mysql-summary.txt.
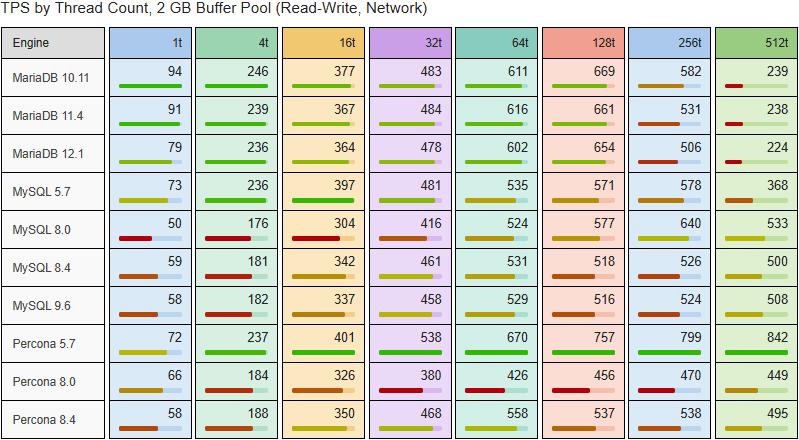
The read-write local benchmark tests mixed OLTP transactions over loopback connection. → Open interactive graph
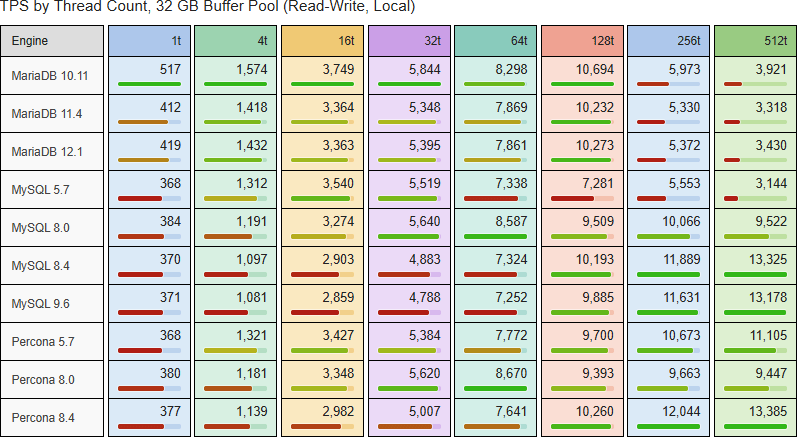
At 32 GB, MySQL 8.4 and Percona 8.4 demonstrate good high-concurrency scaling through 512 threads (13,325 and 13,385 TPS). MariaDB engines peak at 128 threads then show a notable decrease in performance, though MariaDB exhibits much better single-thread performance, especially visible in version 10.11. MySQL 5.7 peaks early at 64 threads.
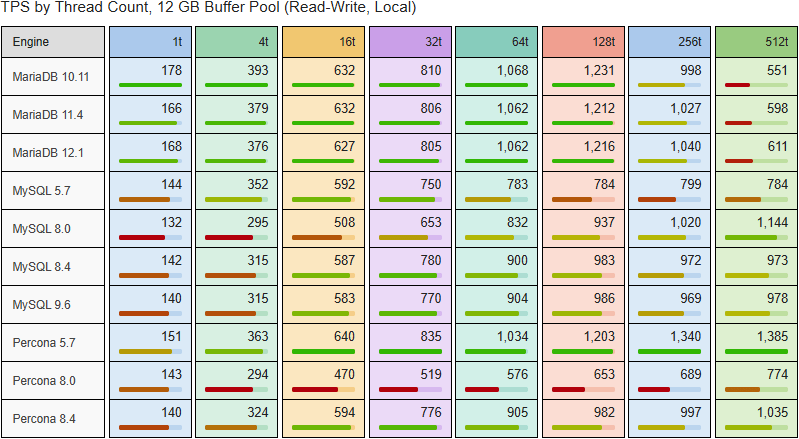
At 12 GB, Percona 5.7 leads with 1,385 TPS at 512 threads. MariaDB engines peak around 128 threads. MySQL 8.0 uniquely continues improving to 1,144 TPS at 512 threads.
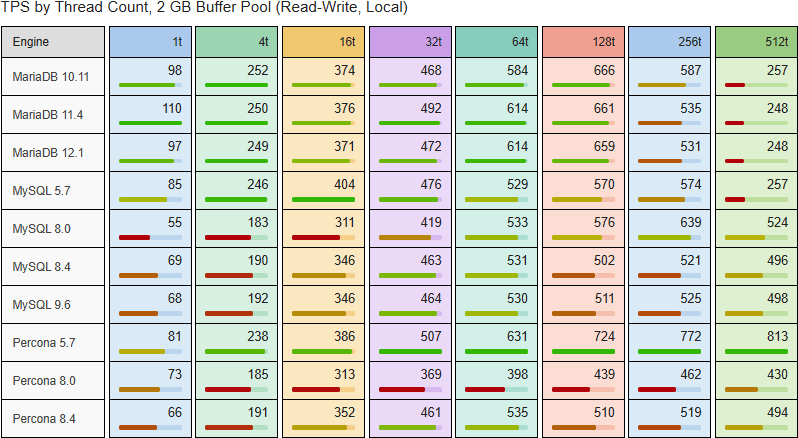
Under severe memory pressure (2 GB), Percona 5.7 dominates at 813 TPS (512 threads). The 8.4-generation engines plateau around 530 TPS. Percona 8.0 shows the worst overall performance at this tier.
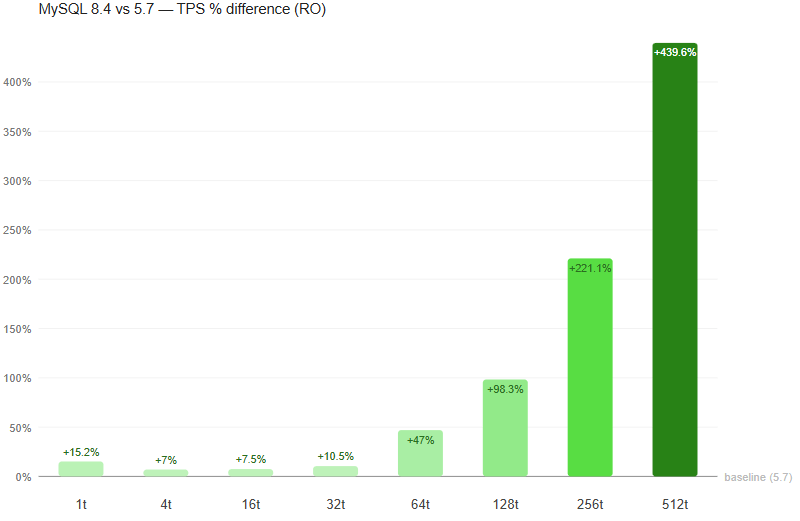
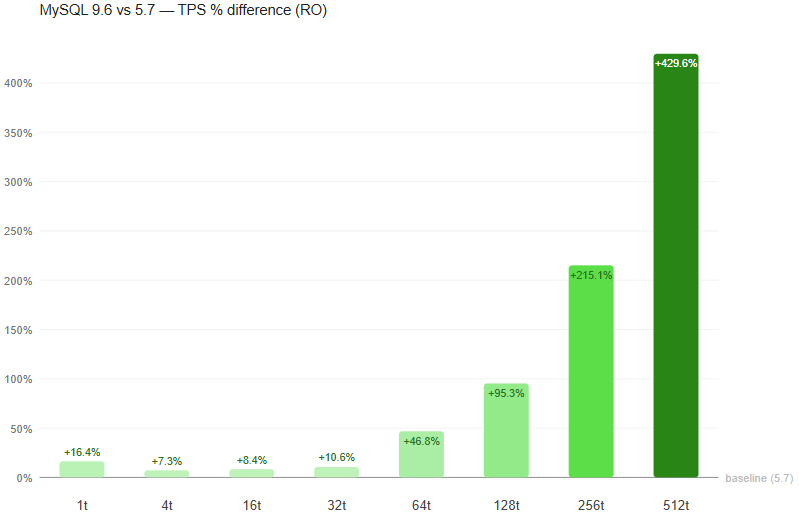
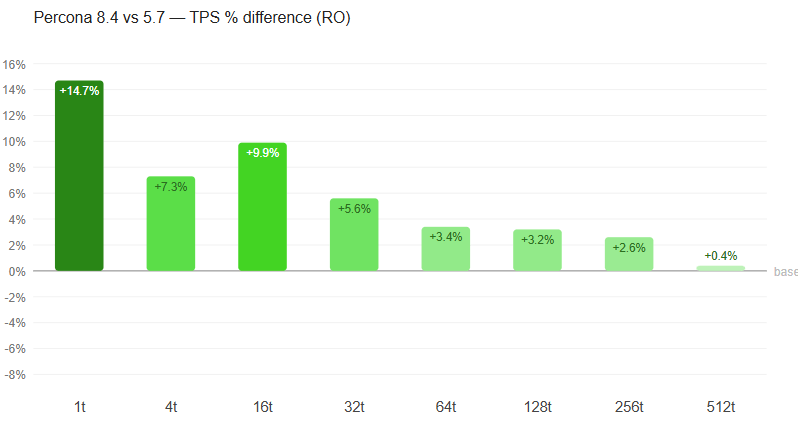
The read-only benchmark eliminates write contention, revealing pure read-path scalability. → Open interactive graph
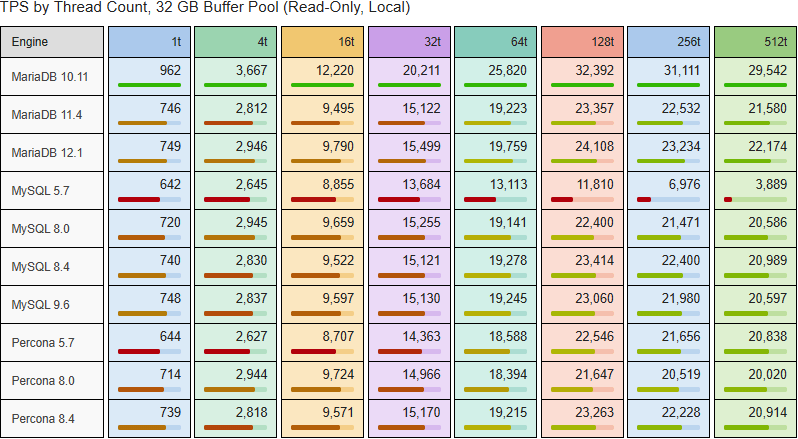
MariaDB 10.11 dominates with 32,392 TPS at 128 threads — 38% ahead of the next engine. MySQL 5.7 peaks at 13,684 TPS (32 threads) then collapses to 3,889 at 512 threads.
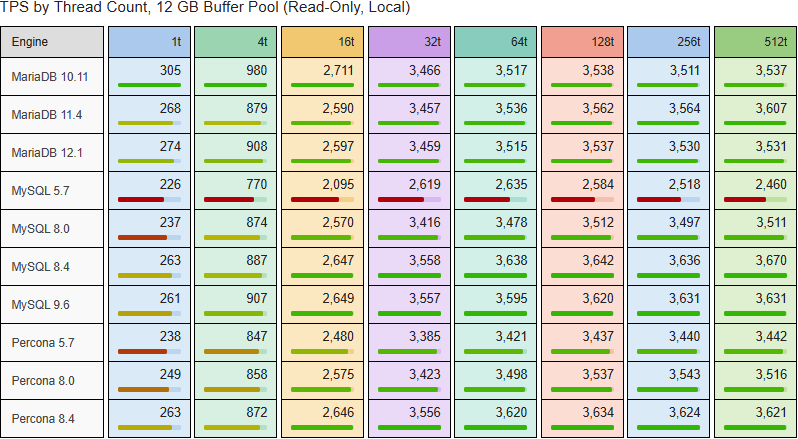
All engines converge into a tighter band. MySQL 8.4 and 9.6 lead at ~3,670 TPS. MySQL 5.7 shows a flat curve above 32 threads (~2,600 TPS).
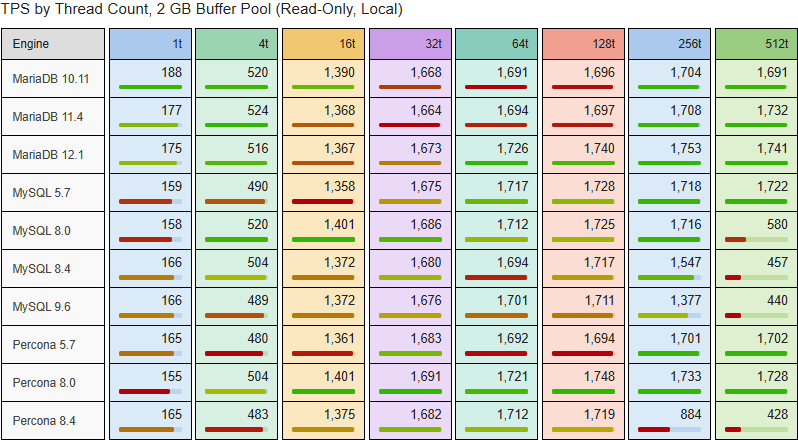
Read-only workloads saturate early. MariaDB 12.1 leads slightly at 1,753 TPS. MySQL 9.6 and Percona 8.4 degrade sharply above 128 threads.
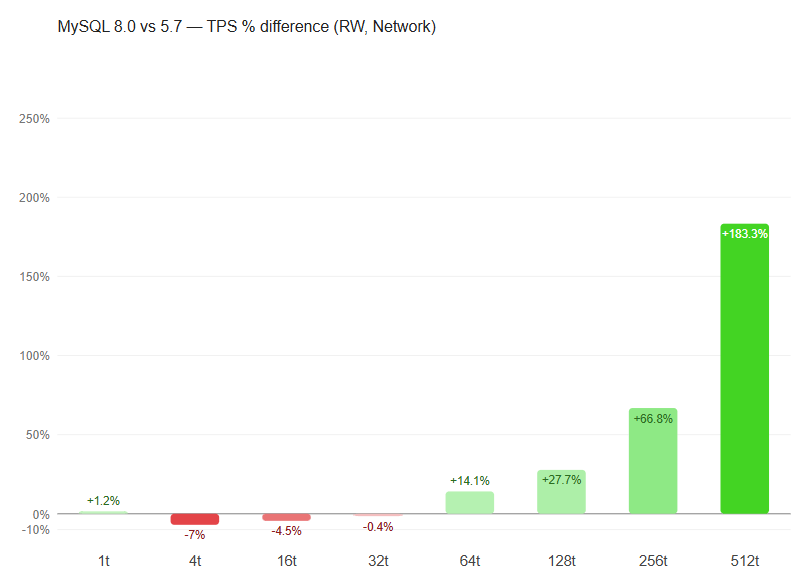
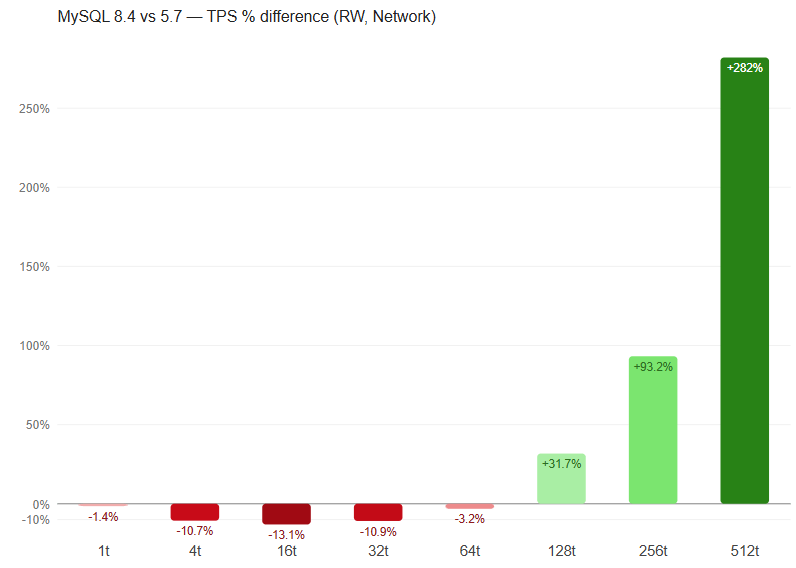
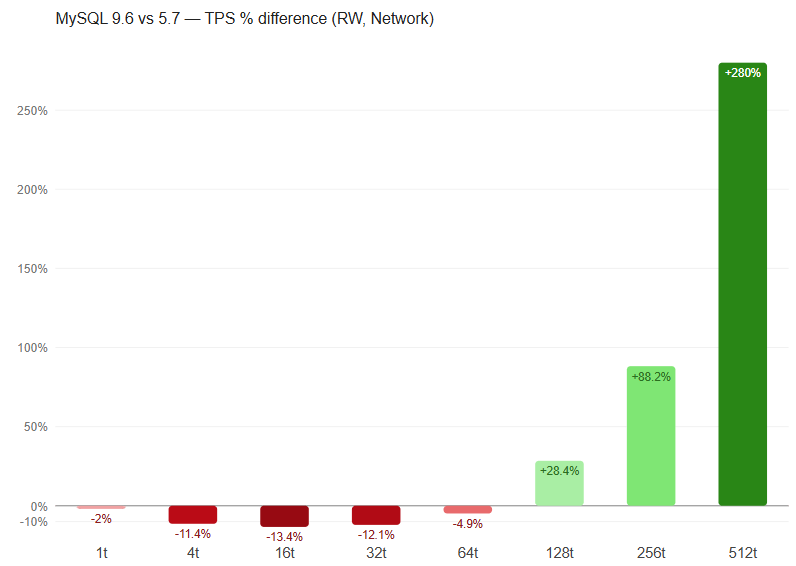
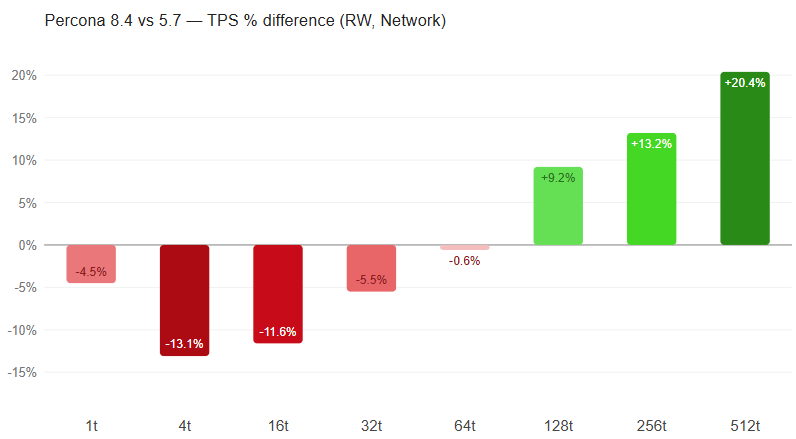
The network benchmark measures read-write OLTP over 10Gb/s Ethernet. → Open interactive graph
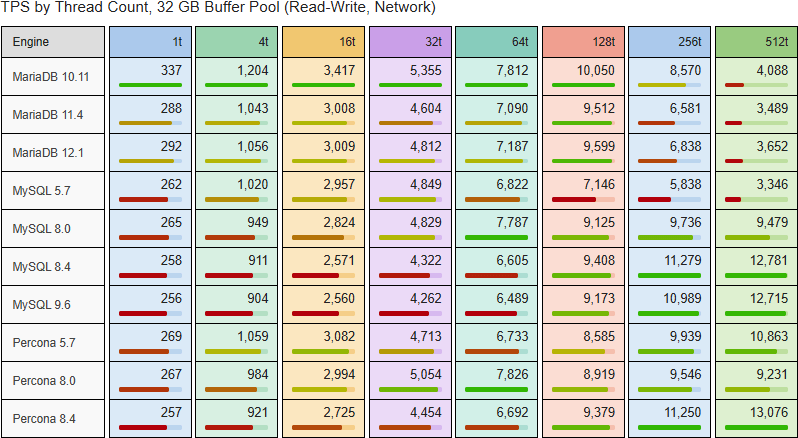
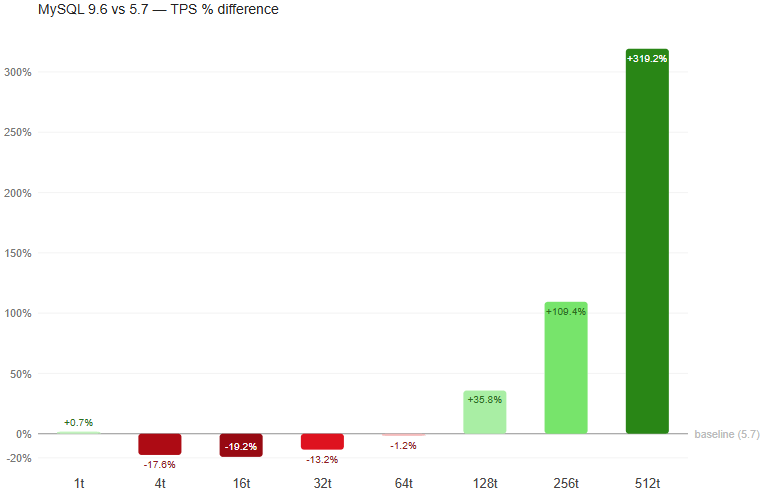
MySQL 8.4/9.6 and Percona 8.4 reach 12,781, 12,715, and 13,076 TPS at 512 threads. MariaDB 10.11 peaks at 10,050 (128 threads) but degrades to 4,088 at 512.
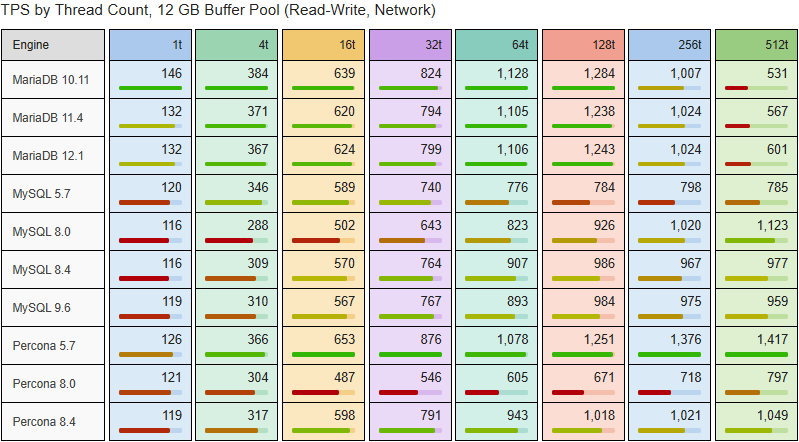
Percona 5.7 leads at 842 TPS (512 threads). MariaDB engines peak at 128 threads (~655 TPS). Network overhead adds 2–5% to I/O-bound limitations.

oltp_read_write and oltp_read_only workloads are synthetic OLTP approximationbs. Real application query distributions differ; results should be treated as directional, not absolute.All benchmark scripts are published at github.com/Percona-Lab-results/2026-interactive-metrics/tree/test-data.
OS support is currently limited to Ubuntu 24.04.
The repository contains four entry-point scripts. To reproduce:
1. Install prerequisites:
|
1 |
sudo apt install docker.io sysstat sysbench mysql-client dstat -y |
Grant Permissions: Add your current user to the docker group by running:
|
1 |
sudo usermod -aG docker $USER |
Log out and back in, or run newgrp docker to update your group permissions without restarting.
Note: The user requires root access (sudo) as the scripts internally execute sudo commands for environment management and telemetry collection.
2. For local read-write benchmarks:
|
1 |
./run_all.sh |
Calls run_metrics.sh for each engine. Results stored in benchmark_logs/{db}/{version}/.
3. For local read-only benchmarks:
|
1 |
./run_all.sh 1 |
Enables read-only mode. Results stored in benchmark_logs_read_only/{db}/{version}/.
4. For network read-write benchmarks:
Install prerequisites on the remote host and add the user to the docker group as described in step 1.
|
1 |
./run_remote_all.sh <ssh-key-path> |
Manages Docker on remote host via SSH, deploys config via SCP, collects telemetry remotely. Results in benchmark_remote_logs/{db}/{version}/.
5. For network read-only benchmarks:
|
1 |
./run_remote_all.sh <ssh-key-path> 1 |
Combines remote execution with read-only mode. Results in benchmark_remote_logs_read_only/{db}/{version}/.
Each run_metrics.sh / run_remote_metrics.sh invocation handles the full lifecycle for one engine: container startup, version detection via SELECT VERSION(), configuration generation with version-specific branching, buffer pool verification, data preparation (20 tables × 5M rows), two-phase warmup, and 15-minute measurement runs at all eight concurrency levels across all three buffer pool tiers. System telemetry (iostat, vmstat, mpstat, dstat) is collected at 1-second granularity alongside each measurement. Server variables (SHOW VARIABLES), status counters (SHOW STATUS), and pt-mysql-summary output are captured per tier.
Default Schema sbtest is created upon docker container run. Tables are populated with the following sysbench command:
|
1 2 |
sysbench oltp_read_only --mysql-host=$DB_HOST --mysql-user=$DB_USER --mysql-password=$DB_PASS --mysql-db=$DB_DATABASE --tables=20 --table-size=$TABLE_ROWS --threads=64 prepare |
The benchmark uses a single tuned config rather than default settings, for a deliberate reason: default configurations are not representative of production deployments and systematically understate the performance potential of modern InnoDB. The config applied here is conservative but reasonable — it does not apply per-engine exotic tuning, ensuring all engines compete on roughly equal footing at a production-realistic baseline.
MariaDB provided this response with some valid recommendations about configuration in newer MariaDB versions:
However, there are issues in the implementation ofinnodb_snapshot_isolation which MariaDB uses by default:
MDEV-39263 – innodb_snapshot_isolation fails to prevent lost updates under contention
MDEV-39264 – innodb_snapshot_isolation allows non-repeatable reads after UPDATE on unrelated column
We will review specific benchmarks and provide the results.
Report generated from raw benchmark data in branch raw-data of the repository. Charts generated with matplotlib. Document assembled programmatically.
Percona Lab Results · 2026 · github.com/Percona-Lab-results/2026-interactive-metrics