
Monday, 9:00. The app team writes: “MongoDB was slow on Thursday afternoon. What happened?” No alert fired, nobody looked at the time, and now it is your problem.
The answer is usually in the FTDC. Every mongod writes a sample of its own metrics once per second into diagnostic.data, and MongoDB calls this Full Time Diagnostic Data Capture. On Atlas, we measured an M10 under production traffic keeping only two to five days of it, so Thursday may already be gone.
If you still have the files, you open them in a viewer and start reading charts around Thursday afternoon. If you are lucky, the cause is on one of the first ten charts. If not, you read another forty. And nobody reads the rest of the file. A missing index that scans 10 million documents for every one it returns, a disk that takes 400 ms per write for three minutes, a member that loses packets for 30 s: all of it is in the FTDC, and most of it is never reported.
mongo-health does that reading for you, on self-managed replica sets and on MongoDB Atlas. It keeps every second of FTDC for 3 months, runs 68 checks over it every hour, and gives you one verdict per cluster. By Monday, Thursday is already on the page: what happened, on which member, for how long, and the chart to send the app team.
It is open source (Apache 2.0), runs as three Docker containers on your laptop or a server, and installs nothing on the database hosts. Install it in four commands from mongo-health on GitHub.
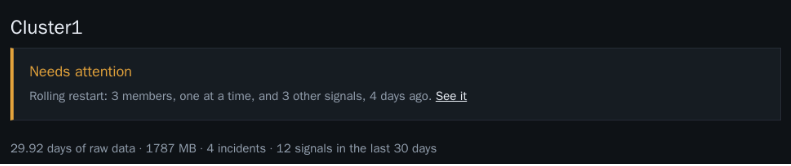
You open the page for the cluster. The verdict comes first, and its link goes straight to the finding behind it. This one is an Atlas M10 we keep for testing, with 29.92 days of FTDC. A cluster that stops sending data reads “Not being watched”, never an old “Healthy”.
Click a finding and you get a card. Take the disk one further down: writes took up to 400 ms, the chart shows it second by second on the three members, and a line says it is the third time on this cluster. Below that, a short note on where to look next. Once you have fixed the cause, press I fixed this and leave a note. The card leaves the report, and if the problem comes back, mongo-health shows it as a repeat.
The 68 checks cover tickets and queues, cache and memory, storage, replication, connections, queries, configuration and the cluster’s own history. The README lists them by group, and docs/rules.md explains each threshold.
Each heading below is a complaint an app team sends a DBA all the time. Under it is the card mongo-health built for the problem behind it. We caused five of the problems on purpose, on a three-member Percona Server for MongoDB 8.0 replica set in our lab. The sixth happened on its own on the Atlas M10. Nothing in the screenshots was edited.
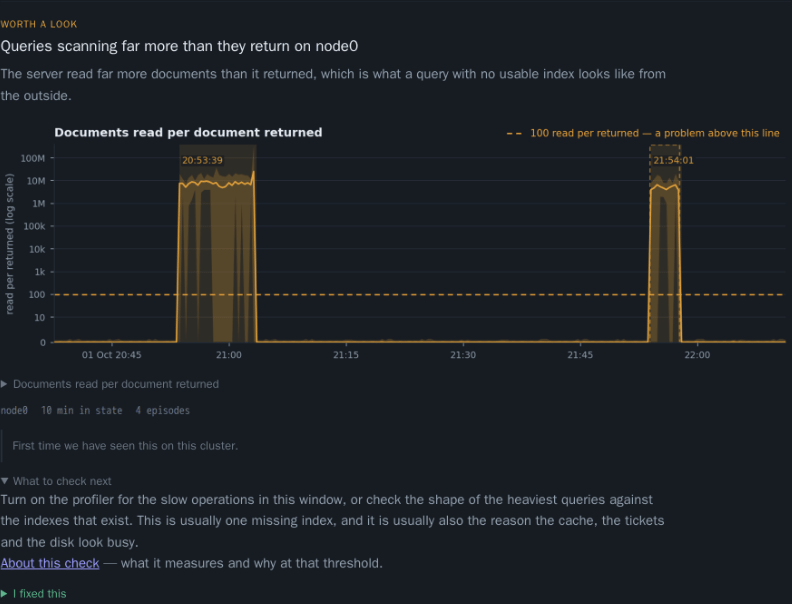
We ran a query on the lab that had no index to use. From 20:53 the server read about 10 million documents for every one it sent back, for 10 minutes, and then again at 21:54. Anything above 100 to 1 is enough for the rule. Nothing failed and nothing showed in the log, so you would never have found it there. The card points to a missing index and gives you the minute it started, which you can check against the app team’s last deploy.
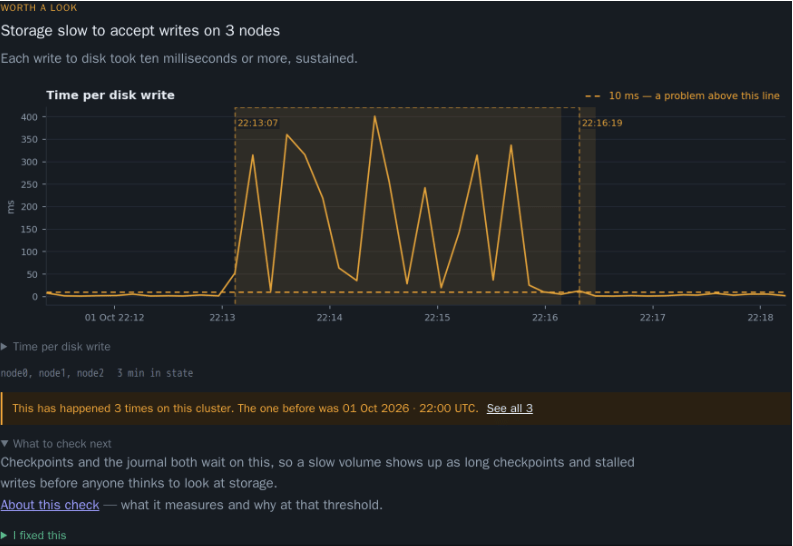
At 22:13 the disk under the lab got slow. For three minutes, writes on all three members took up to 400 ms each, and the rule draws the line at 10 ms. It was not the first time. The card counts three on this cluster and links the other two, which turns “bad luck” into a pattern you can take to the storage team.
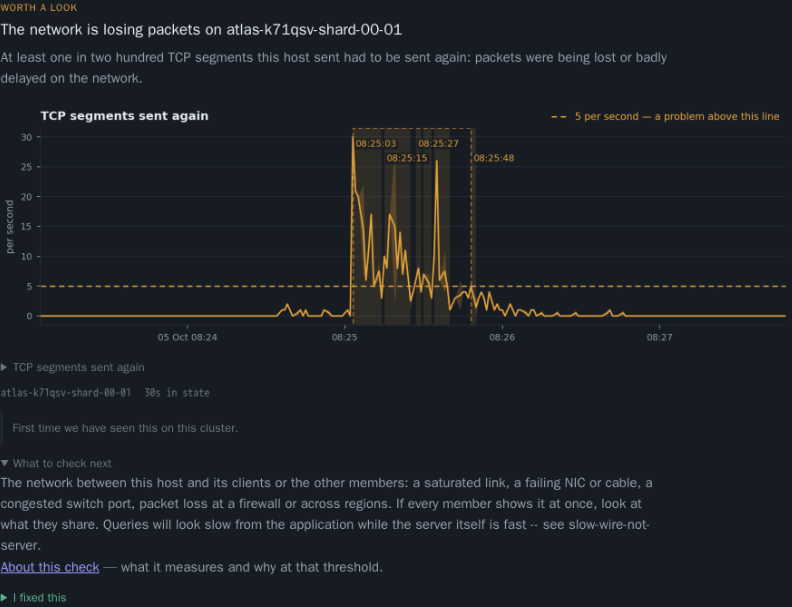
This one we did not cause. On 5 Oct at 08:25, one member of the Atlas M10 retransmitted up to 30 TCP segments a second for about 30 s, and the rule starts at 5. The server itself answered quickly. The packets got lost on the way. There is nothing to fix on your side, but you can stop looking for a slow query that never existed and open a case with the chart attached.
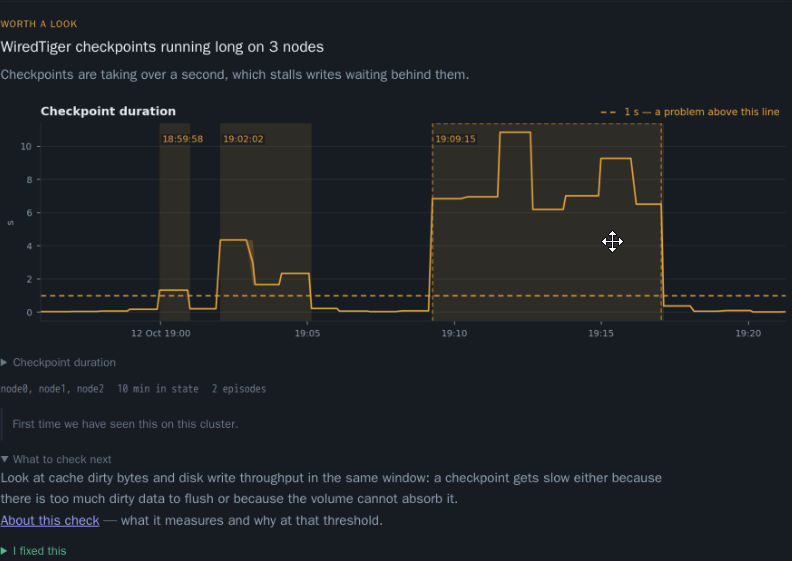
We pushed a steady stream of bulk rewrites at the lab, and checkpoints that normally finish in under a second started taking 6 to 11 s on all three members. It happened twice in 10 minutes. The rule waits until checkpoints stay above 1 s for two minutes, so a single slow one does not raise it. This kind of freeze rarely shows on a throughput chart, which is why it so often ends as “we don’t know what happened”.
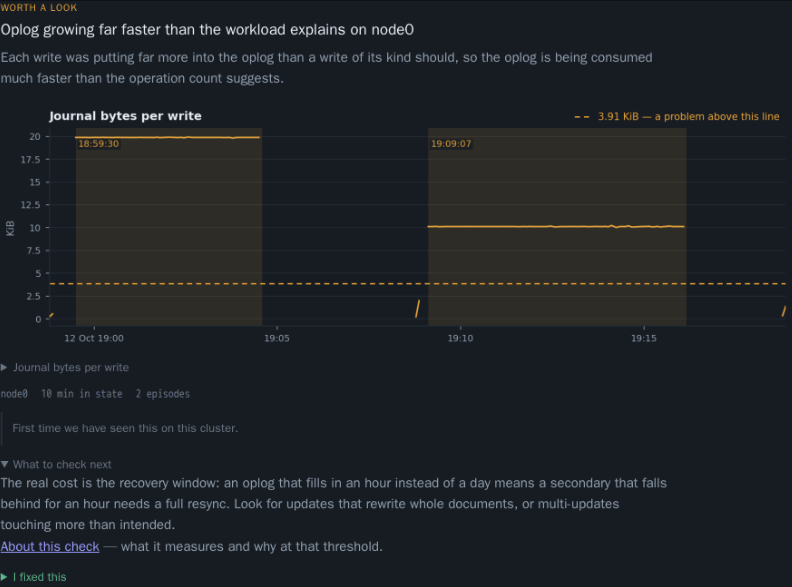
Nobody would have called about this one yet. The lab took about 250 writes a second, a number that looks harmless on any operations chart. But every write replaced a whole 20 KB document, so each one put about 20 KiB into the journal, and the rule starts at 3.91 KiB. At that pace the oplog fills in an hour instead of a day. Then a secondary that falls an hour behind needs a full resync, so this is the time to fix the update pattern.
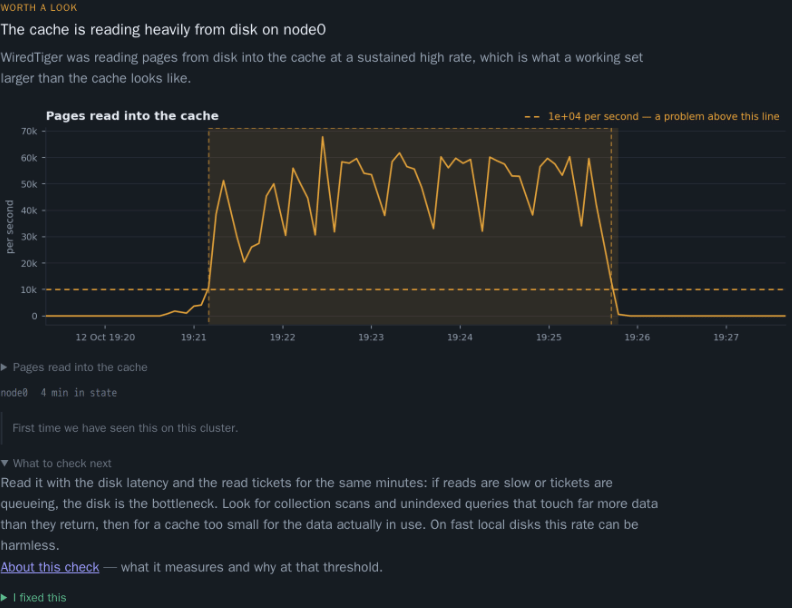
Here we shrank the WiredTiger cache to 128 MB and scanned a 1.9 GB collection. For 4 minutes WiredTiger pulled 20,000 to 68,000 pages a second from disk, and the rule starts at 10,000. The data the report needed simply did not fit in memory. The card does not call that a problem by itself. It sends you to the disk latency and the read tickets first, because that is how you decide between more memory and a better query.
A self-managed replica set needs a user with the clusterMonitor role, and the poller calls getDiagnosticData on each member every 10 s. Atlas needs an API key with Project Read Only, the lowest role Atlas has, and the FTDC files come through the Atlas Admin API. You can also upload diagnostic.data from a support bundle. The README has the steps for each.
mongo-health does not replace your monitoring. It reads the FTDC once an hour, so a problem can be up to an hour old before it reaches the page, and it never pages anyone. Keep PMM, or whatever wakes you up today, for alerts. It also works with replica sets only. Sharded clusters are not supported yet, and the README lists the other limits.
Live monitoring tells you what is happening now. mongo-health tells you what happened at every second of the last three months, on every member, and which of it matters. The next time someone asks about Thursday, you answer with the chart, the member and the minute it started, not with “we could not find anything”. Often you have the answer before they ask.
The install, the checks and the configuration are in the README on GitHub.
For the details of FTDC itself, see Full Time Diagnostic Data Capture in the MongoDB manual. The rules come from Big Hole, and each one is documented in the repository.
If you try it, I would like to hear what it found and what it missed. The most useful feedback is FTDC from an incident it did not catch: open an issue on the repository, or leave a comment below.
Resources
RELATED POSTS